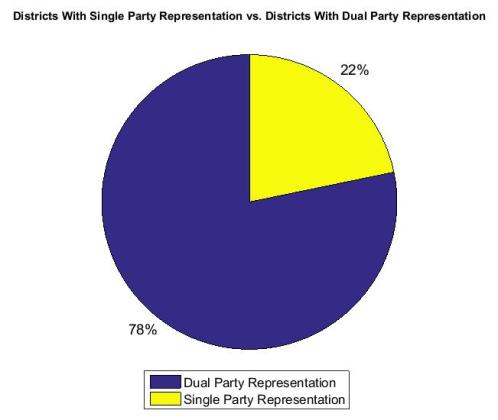
This page shows simulations of past Canadian federal elections that use DMP to calculate the outcome. These simulations assume that each district was given an additional representative. Of course, if DMP is used in future elections, districts would more likely be amalgamated than given extra representatives. However, this choice does not have a significant impact on simulation results. Finally, a reserve factor of 10% and a district threshold of 5% were used to produce the simulations.
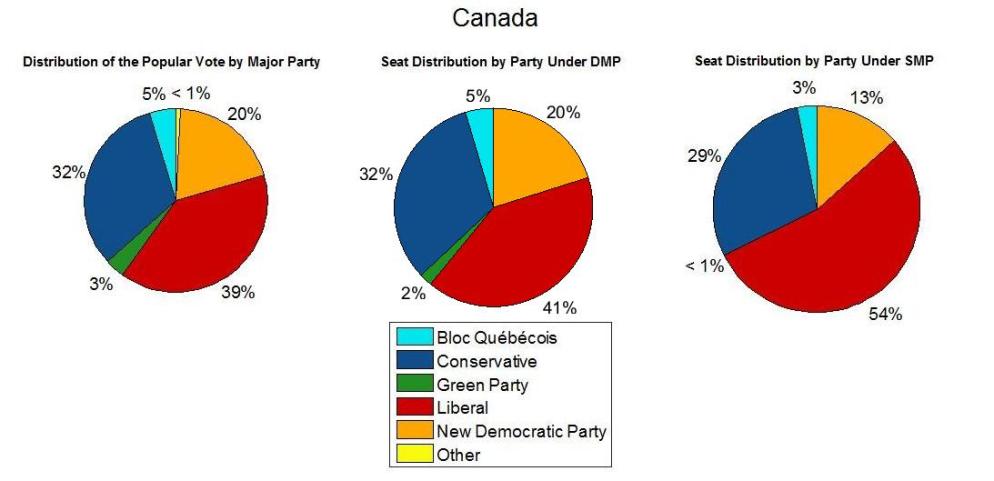
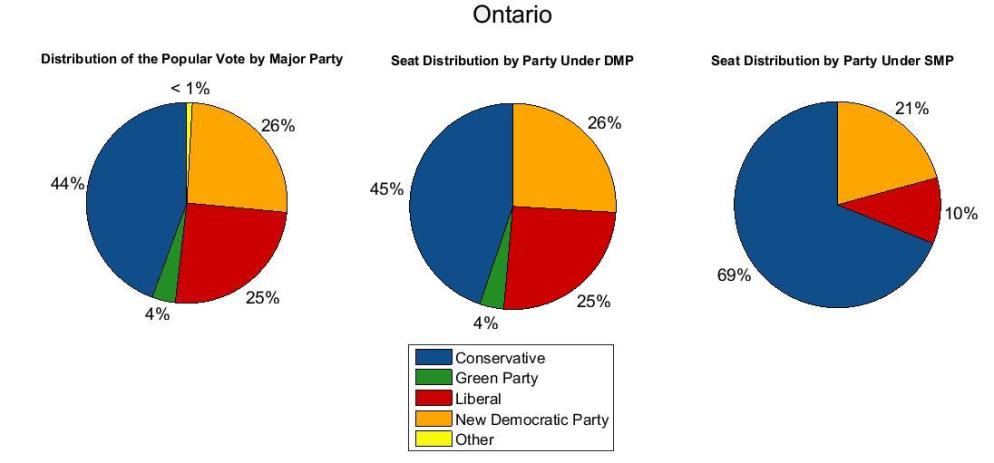
2015 Federal Election
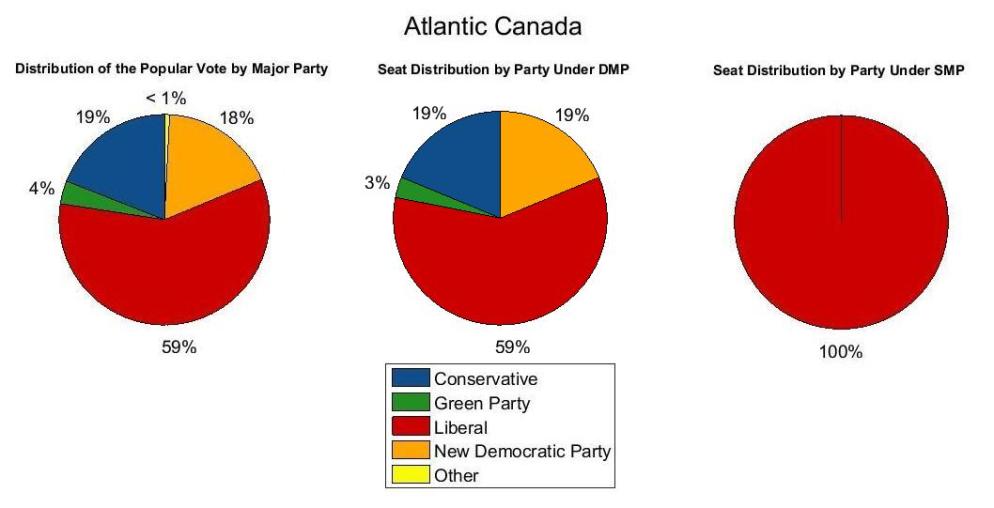
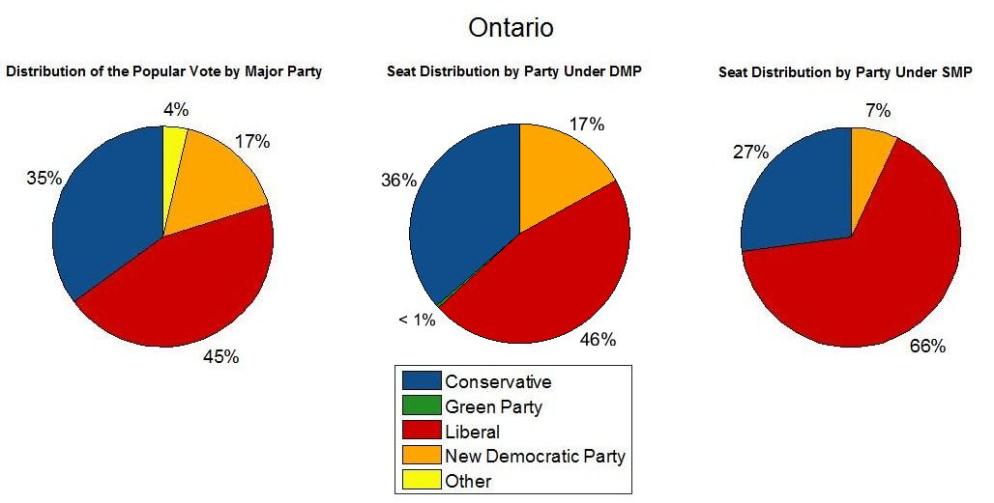
To determine the outcome of the 2015 federal election, Canada was divided into four regions:
- Atlantic Canada (PEI, Newfoundland and Labrador, Nova Scotia, and New Brunswick)
- Quebec

- Ontario
- Western Canada (Manitoba, Saskatchewan, Alberta, BC, Yukon, Northwest Territories, and Nunavut)
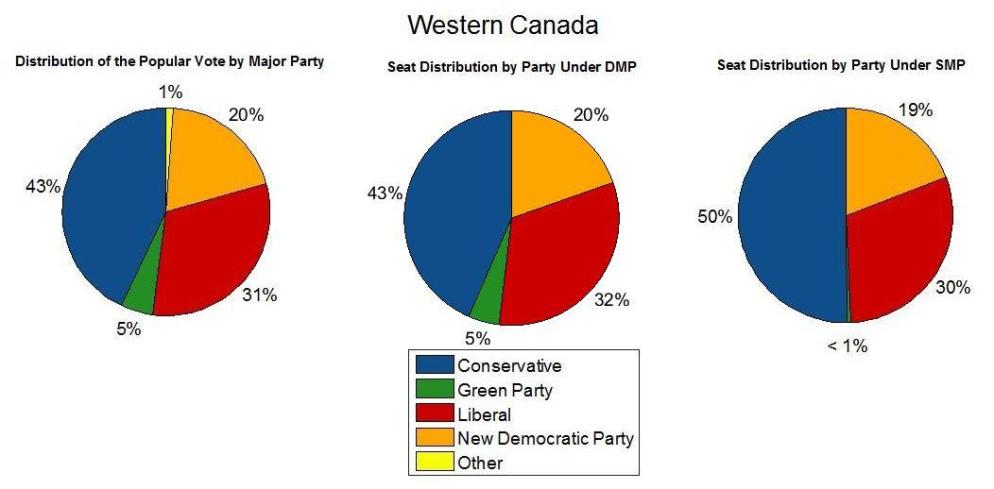
The country wide results are given below and the district level results can be viewed here.


2011 Federal Election
To determine the outcome of the 2011 federal election, Canada was divided into four regions:
- Atlantic Canada (PEI, Newfoundland and Labrador, Nova Scotia, and New Brunswick)

- Quebec

- Ontario
- Western Canada (Manitoba, Saskatchewan, Alberta, BC, Yukon, Northwest Territories, and Nunavut)

The country wide results are given below and the district level results can be viewed here.